top of page

PROJECT OVERVIEW
Enhancing Mapping and Design Experiences
At Equator Studios, which provides users with high-quality, easy-to-access elevation data and map design tools. Low retention rates on their application motivated the team re-think the user experience of their platform.
DATE
December 2021
SERVICE
User Onboarding
ROLE
User Experience Designer
CLIENT
Equator Studios
CLIENT OVERVIEW
About Equator Studios
Equator provides users mapping software used for extracting high-quality data and creating custom maps.
This clip shows the Point Cloud and Contour maps loading on my site
Equator provides users with various 3D topographic maps including Point Cloud, DEMs, Contour

Equator provides users mapping software used for extracting high-quality data and creating custom maps.
CLIENT OVERVIEW
Equator Studios
Target Audience: Civil Engineers
Civil engineers utilize Equator Studios, a mapping and design software, to efficiently access high-quality topography and GIS data, streamlining their project planning and proposal processes.
Target Audience: architects & landscape Designers
Architects and landscape designers use Equator to enhance the design process by incorporating accurate mapping and elevation data.
Civil Engineering (50%)
Architecture (9%)
Education (16%)
Other
50%
9%
16%
Breakdown of Users
These numbers are based off of the many metric platforms tracking user activity as well as user interviews.
BACKGROUND
What is the current state of Equator’s platform?

VISIBILITY OF SYSTEM STATUS
Placement of call to action button, shown in green, isn’t clear. As a user, I’m not sure where to click next.
Green loading pop up with white text lacks contrast.
FEEDBACK

VISIBILITY OF SYSTEM STATUS
Lack of visual hierarchy in the global navigation
INSUFFICIENT COLOR CONTRAST
My site is here, but its difficult to make it out against the rest of the page.
Here is a recap of the tasks we had users complete for our first usability test.
USABILITY TESTING
Tasks Overview
Task 1
Create Contour
Task 2
Add public data
Task 3
Export contour layer
Task 4
Export all site layers


Task 5
Create Proposal
Task 6
Navigate back to map
Task 7
Upload LiDAR file


Improve the experience around; (1) searching, creating a site, and loading mapping data, (2) improve the workflow for customizing & marking up data, (3) uploading & downloading the map
Product Goals
BACKGROUND
Where do Equator users get frustrated?

PROBLEM COMPONENTS
How can we improve the experience around creating, customizing, and exporting topographical data?
Overview
Users want an intuitive workflow and sufficient visual feedback because spending time to find what they need may cause them to give up.
Project goal
Increase users’ success rate in onboarding and creating graphical data.
01
Information Architecture
02
Website Navigation
03
Visual Design
Design goals
Improve the experience around; (1) searching, creating a site, and loading mapping data, (2) improve the workflow for customizing, marking up, adding additional data, (3) uploading & downloading the map, & creating project proposals.
01
Create a site
Find a location
Edit site boundaries
02
Add data & markups
Customize data products
Add measurements & annotate
03
Export, Download & Share
Toggle between layers
Create proposals
Design Concept
01
Helping users find a location, edit boundaries, & create a site.

01
Create a site
Figjam features a floating horizontal toolbar on a whiteboard, which I believed would be effective for the site builder. By relocating tools only accessible after site creation to a separate page, we can streamline the interface, removing clutter and clarifying the site creation process for users.

02
Helping users add data layers, markup maps, & download or share their files.

02
Add data & markups
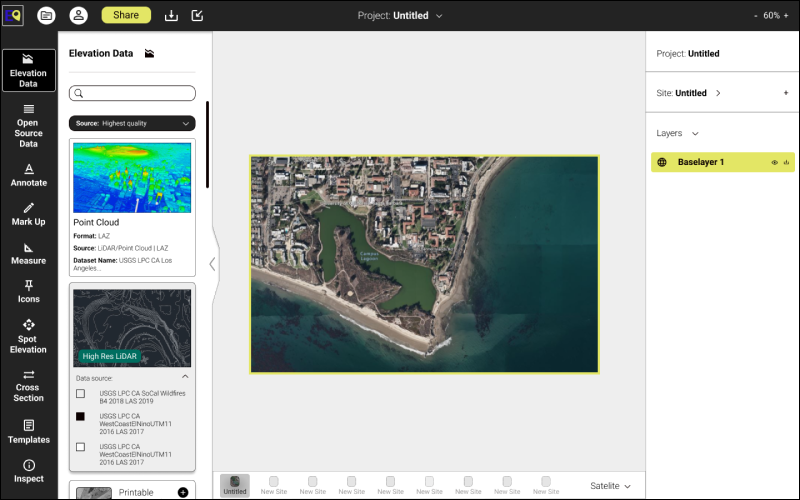
Each top-level category is represented by an icon and text, enhancing accessibility for icons like “cross section” that may be unfamiliar to some users. Upon selection, each category follows a consistent format: a searchable list with filters and items organized by category. Adding items is streamlined with a simple click, and visual feedback for the selected top-level category offers users a clear reference point for navigation

03
Helping users add data layers, markup maps, & download or share their files.

03
Export, Download & Share
Figma's layers panel is straightforward, featuring pages at the top to indicate the current page, with layers displayed beneath. The use of distinct icons, bold and regular text styles, and colors helps differentiate between images and text, as well as whether elements are within a frame or group.

Core User Needs
There are a few key actions that users need to be able to take from a user-facing perspective:
1
LOCATION SEARCH
Users need a way to find their site.
Users start the software with “Start Now”, search for a location, and zoom in on the base map.
2
SITE BUILDER
Users need a way to define their site area.
Users go to the site builder, narrow the site area, and create the site area perimeter.
3
LAYER SELECTION
Users need a way to add data layers to the base map.
Users select a topographic layer or search for public data layers, then add the layer onto the base map. Users can repeat layer selection as many times as needed, or continue to the export step.
4
EXPORT
Users need a way to export their work.
Without a report, users go to layers, select individual layers or a single site, then export and download. With a report, users go to report view, select a layout, edit and annotate, and export as PDF, PNG or other formats.
User Flow Diagram
There are a few key actions that users need to be able to take from a user-facing perspective:

01
Find your site


LOCATION SEARCH
Users need a way to find their site


02
choose site boundaries

SITE BUILDER
Users need a way to define their site area
05
measurement tool action bar

04
Customizing Point Cloud data

03
Add & Open source data

02
Add contours to the site
01
Site layers view

LAYER SELECTION
Users need a way to add data layers to the base map
04
Projects & files

03
Sharing

02
Report templates

01
Exporting Data layers

DESIGN
Exporting, Sharing, Projects & Templates
bottom of page